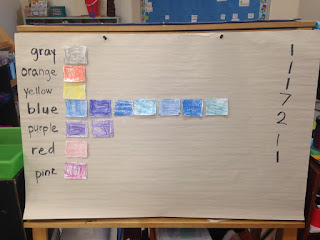
First we colored squares to represent our favorite colors. I then gave them the task of organizing our colors so that we can figure out how many of each we had. They chose to sort them into piles. I then asked if there was a better way so that we could see all the colors and they put them into lines.
From the lines I introduced charting them in a graph so that we can easily see how many of each color we had. Next we counted how many of each color we had and recorded the number.
Lastly, we learned how to "analyze" our data. I asked a series of questions and they started to generate some observations. I recorded their observations on the bottom of the graph. I guided them through the two observations at the top - where we compared one set of colors to another.
Try graphing at home - it's super easy - make a cup of "gorp" from several ingredients (popcorn, m&m"s, cheerios, pretzels, etc.). Have your child sort the ingredients into piles and then into lines similar to a graph. Next talk about what the graph is "telling" you! You can do this with toys, blocks, coins etc., food is just really fun and yummy :-)


No comments:
Post a Comment